How to Create a Custom Excel Report
Walk-Thru On How To Create A Custom Excel Reports
Provided by GPS Tracking Canada
..back to Custom Reports Knowledge Base
..back to Geotab User Resources
Selecting and Opening the Report you want to customize
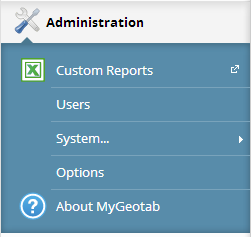
Within MyGeotab, go to Administration -> Custom Reports
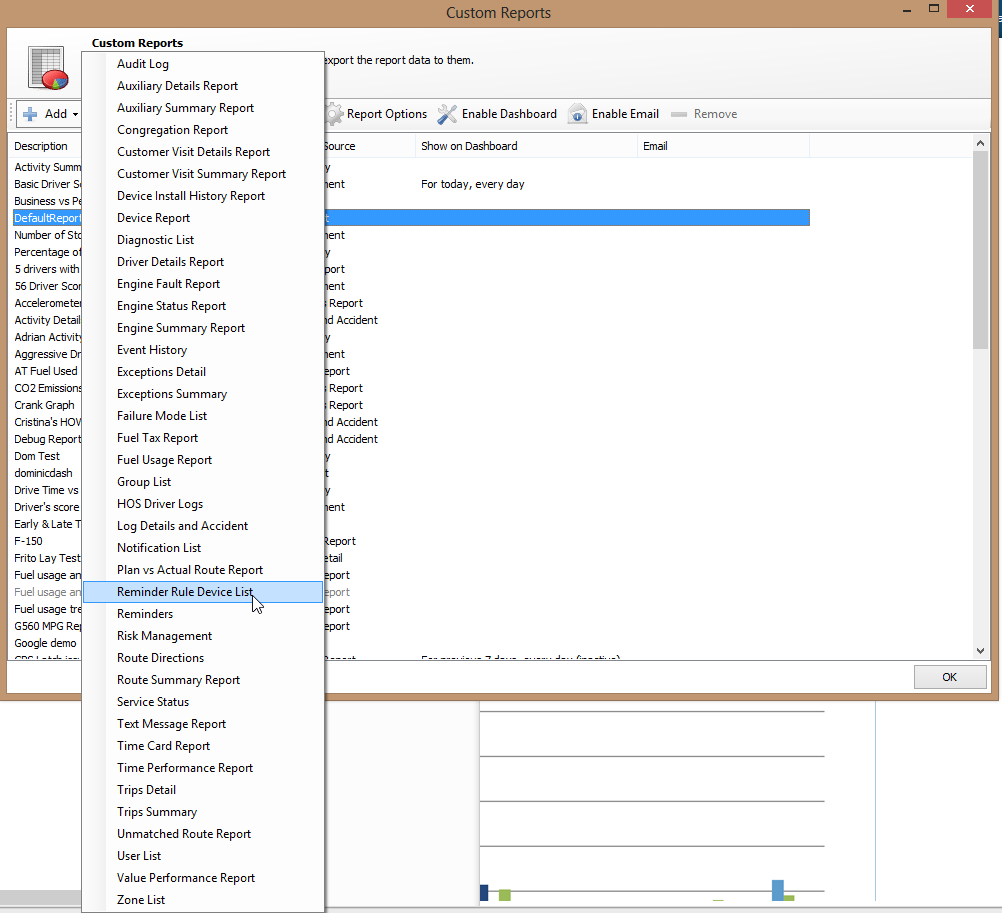
Now Click on Add and select the type of report you want to customize.
- The report template will open in Microsoft Excel. You can now begin modifying the report
Modifying the report in Microsoft Excel
Once you have selected the report you want to edit, it will open up in Excel and you will see two sheets, Report and Summary. There is a third sheet which is hidden and is where MyGeotab will import the data to called Data. This sheet cannot be deleted and you should avoid doing any manipulation.
Most of the manipulation should be done in the Report sheet, this is where you would use the built-in Excel formulas to extract the data from the Data sheet. There is a default named range called AllData in this sheet, this range covers all the data fields and column headings. Make sure that all manipulation is done within this range as the PivotTable in the summary sheet references it.
The Summary sheet is where you will find the PivotTable and where you can add a PivotChart which is what is commonly used on the dashboard.
The last thing you focus on before saving and exiting Microsoft Excel will be what is showed on the Dashboard if you choose to enable that feature for this report.
Saving the report into MyGeotab
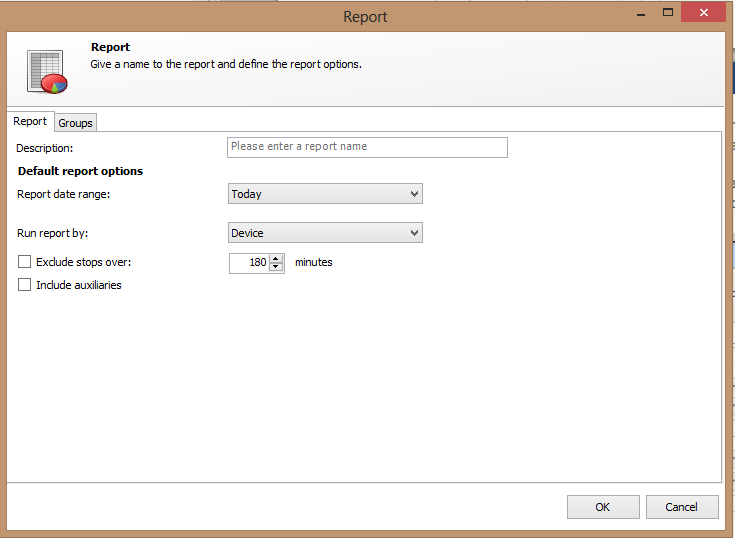
Once you have saved the Excel file and close Microsoft Excel you will get a pop up in MyGeotab where you will be able to give the report a name, select the report options and choose what assets this Report should be run for when done manually.
Enabling Dashboard and Email
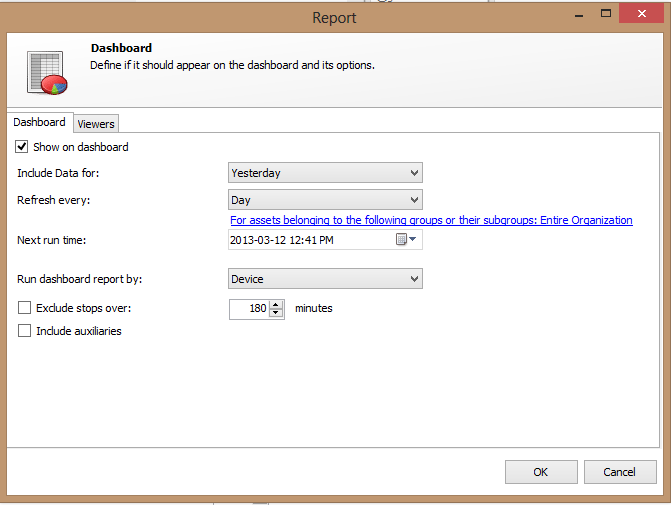
After you have successfully added/imported your Custom Report you are given the option to enable it as a scheduled Dashboard or E-Mail.
Common options between both the Enable Dashboard and Enable Email Features:
Include Data For: this is the date range for the data that will be displayed in the report.
Dashboard options: Previous Hour, Today, Yesterday, Previous 24 Hours, This Week, Last Week, Previous 7 Days, This Month and Last Month.
E-mail options: Previous Hour, Today, Yesterday, Previous 24 Hours, This Week, Last Week, Previous 7 Days, This Month and Last Month.Refresh every: this is how often MyGeotab should re-run the report and refresh the graph that is displayed on the Dashboard or e-mail the report out.
Dashboard options: Day, Minute, Five Minutes, Thirty Minutes, Hour, Week and Month.
E-mail options: Day, Thirty Minutes, Hour, Week and Month.For assets belonging to the following groups or their subgroups: This is where you select what the dashboard could include. What the dashboard will actually show will depend on the scope of the user that is logged in as they will only see the groups/assets that they have access to and are within the groups selected in this option.
Next Run Time: This is where you select the next time MyGeotab should run the report.
Run report by: This is where you select what type of entity the report should run by.
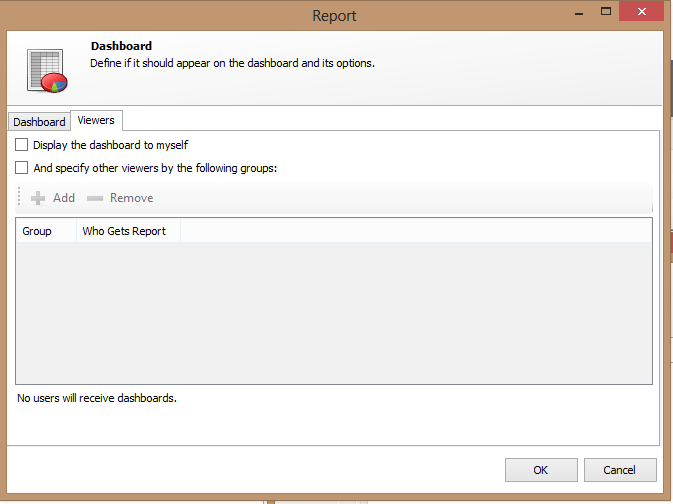
Viewers/Receivers
This is where you choose who is going to be able to view/receive the report. You can select yourself and you can also add groups. When adding groups you can choose to only include the assets within this group or also those within its child groups.