Removing Double Border from Dashboard Graph
How To Remove Double Borders Created By Excel and MyGeotab
Provided by GPS Tracking Canada
..back to Geotab User Resources
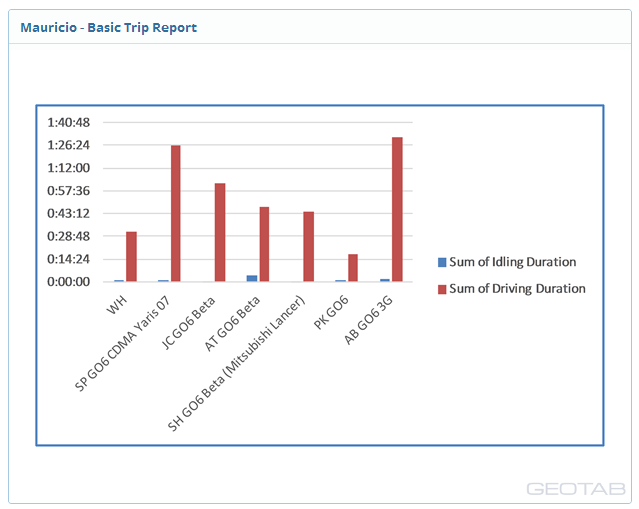
Checkmate will draw the report heading as well as a border around it. By default, Excel also puts a border around the graph and this creates a double border effect.
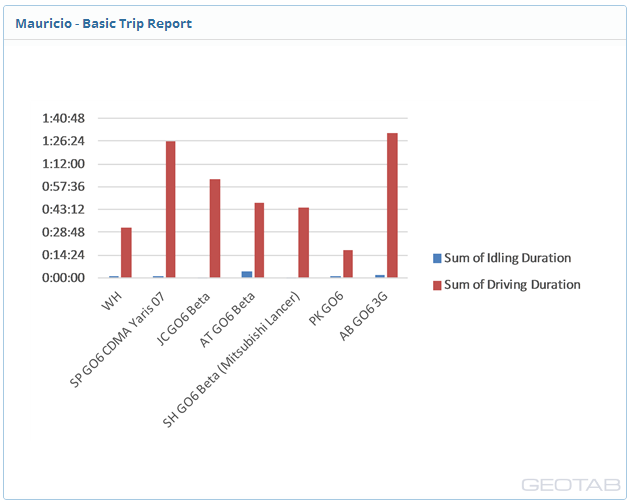
You can easily remove the border from an Excel graph. Right click and select Format Chart Area . In the Border Color section, select “No Line”. The exact steps may vary slightly between versions of Excel but the results will be that the Excel graph will no longer display a border and thus you will only see the MyGeotab Dashboard border: